KubeCon - Observability
Because without observability, well, you really just can't see what's going on

One of the (many) topics I was keen to get into while at KubeCon was observability. This is something that is just so totally and utterly crucial when running this whole “distributed microservice” thing that you really need good solutions to this stuff to make a success of it.
In the case of my team right now, we have some good stuff going on. Prometheus & Grafana are great - digging those a lot. We’re standardising some dashboards for teams that aren’t too fussed, and we’re also seeing some teams do some really funky things beyond that with their instrumented code.
But, below the platform boundary, Prometheus needs some TLC to keep it happy, and that’s before we’ve got any big workloads or large clusters pumping through it.
And don’t even get met started on logging tools …
So, what did KubeCon 2019 have to throw into the mix here?
OpenTelemetry
I’m not going to say too much more about OpenTelemetry as I already talked about it in my post yesterday from the keynote. Very briefly - we will need distributed tracing on our platform and we will probably need it quite soon. It’s great that OpenCensus & OpenTracing are merging because it makes our choice straight-forward. And in the land of CNCF there’s a lot of choices to make. So 👍
Prometheus At Scale
Back at home, we’ve got some stuff going on in this world.
We’ve got a Prometheus stack deployed using the coreos operator with statefulset replicas that are getting pretty beefy now even though our workloads and the cluster we run this for are pretty small.
I’m therefore really interested in solutions to this problem. So today I went to two talks on this topic - one about M3 (which I’d never heard of before) and another about Cortex (which I had).
Starting with M3 - this talk is by Rob Skillington from Uber, M3’s main creator I think. M3 is a newly open sourced thing that does Prometheus at scale. Great - this is exactly what I want.

Cor, look at that logo - strong start!
Unfortunately there are two other open source projects that do this too - Thanos & Cortex.
They also have cooler names. This is a very important factor
So what makes M3 different? To be honest I don’t really know enough about the others to make a fair statement on this. I do see Cortex offering managed database backends rather than something proprietary like M3 & Thanos (and, let’s face it, Prometheus itself). It also sounds like it can go really big - Uber created this thing, and they have a lot of metrics - here’s some stats for their copy:
- 35m metrics stored per second
- 700m metrics aggregated per second
- 1000+ instances running M3DB
- 9 billion unique metric IDs
That’s pretty big. But then the others can probably handle that too, right?
They do have a nice scaling model - their decoupled architecture means they can just keep adding storage nodes based on usage, there’s no onboarding for teams to create capacity for them etc. They’ve clearly also thought about decoupling the ingestion and querying problem having separate resources for each, the ability to set different retention periods to allow you to store some services’ data for years if needed, and running it across multiple regions if you want to, and so on and so on.
I also like the fact that they’ve gone straight in with an Operator for easy installation and minimised the administrative overheads through removal of any need for background task management, replacement of failing instances, scaling, etc. Apparently they only have 2 SREs looking after the thing, which when you look at the size of it above is pretty sweet. It’s nifty stuff, and very tempting to try out.
There were a couple of other interesting observations I noted during the talk too:
- They have 4000 microservices - “let builders build” - there were some sniggers at this in the audience 😄
- It is apparently pretty common when you have metric tools for your engineers to double-down on the amount of metrics - this drives costs for your telemetry tools up to higher than the workloads you are actually running - this happened at Uber, and it happened at Netflix. Cost therefore a motivator here.
This is nice to hear, as we see something similar and, as a retailer these days, cheap is good 😉
- It’s got what sounds like some clever optimisations in querying speed - the ability to distribute and parallelise using an index similar to Lucene, allowing it to filter over billions of metrics. I’m going to take his word for it that this is a good thing.
- They also have teams using it to track business metrics even though it’s not what they say it is for - it’s just too easy for teams to do it through tagging. I am not at all surprised.
Perhaps most intriguingly, Rob also talked about how this has started to be used as a platform in its own right - for example they have some application load balancers basing their routing decisions on the metrics being read out of it.
I did also take in a session on Cortex, although sadly not the intro one so this one went a bit deeper into how Cortex worked - which without the context was as tricky one for me to follow. But how hard can it be, right?
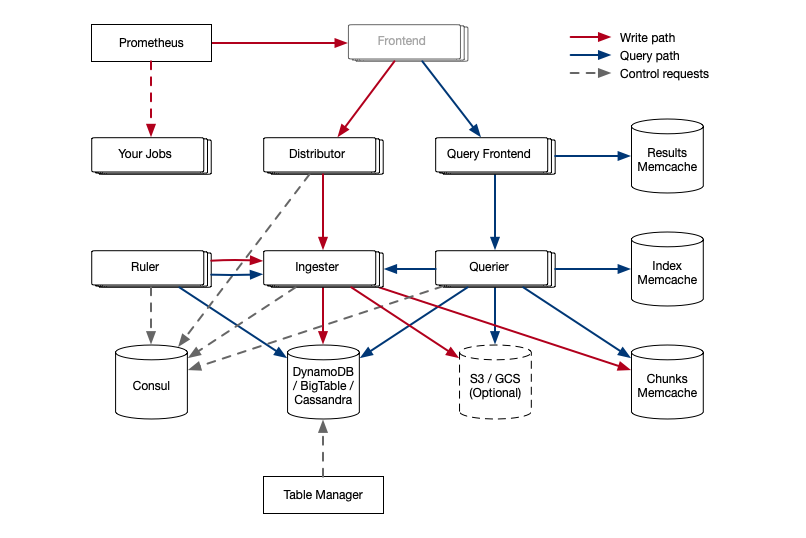
This definitely breaks my ’three box’ rule
The image above is taken from their “concepts” readme.
I did pick up a few nuggets about this too:
- It’s CNCF-based. Which is cool
- It does the scalable / available / resilient / multi-tenant thing for Prometheus. Which is cool
- It can back onto a bunch of managed data stores such as Cassandra, DynamoDB and in particular for me - GCP’s BigTable. Which is cool
- They’re of the opinion that writing your databases is hard and you probably shouldn’t do it. That sounds pretty logical to me
- It uses Consul to reconcile coordination data between its nodes. Which is meh, but they are working on getting rid of this
There focus lately has been on query performance, which they take as a sign that they’ve solved the ingestor performance situation. Nice one.
The Q&A has a couple of noteworthy bits which I liked - one person asks whether they should use Thanos or Cortex, leading to the comedy response of “you are asking me, one of the creators of Cortex, whether I think you should run Thanos or Cortex?” 😄 To be fair, this is followed up with:
- Cortex brings the data centrally, Thanos hits all your separate data stores and brings it together. This is very much a philosophical choice
- Thanos invented their own database which they’re not sure is wise. This parallels the M3 talk earlier too
- However they concede that Thanos was easy to use from Day 1 which was a good move - it’s taken a while to get Cortex to that place. The fact that their demo involves spawning a load of docker containers locally and fiddling with them does point to that also I think! They’re keen for folks to contribute to docs and give feedback on how to make this easier.
So, What About ‘Dem Logs?
So that’s metrics. What about logs? They’re important too right?
Why yes, yes they are. Which is why it’s probably pretty bad that we’ve ignored them, more or less. We’ve got logs going into Stackdriver that our teams tolerate but don’t really like (sorry Google!) as the UI is just not a nice place to be.
So, everyone runs Elastic/Kibana for this stuff right? Well probably, yes. And to be honest we did an eval of it earlier in the year and have a plan to do something with it.
Bit in the meantime, something mischievious has popped up into the mix … enter Loki.

Obvious joke, I know
I went to a talk on this new kid on the block - which is aiming to basically be Prometheus but for logs. The line goes:
“Horizontally scalable, highly available multi-tenant log aggregation system inspired by Prometheus”
Groovy. It appeared on the scene at KubeCon US about six months ago. You can even read the design doc online. It has been, according to its creator, wildly popular since it was announced. He was surprised how much.
I have to say, having watched the demo (which went wrong a bit, but y’know), it does look pretty good. What I like about it is it’s pitched at Developers - it’s not really trying to stomp on Elastic’s turf (at least not yet), but is more focused on giving a software engineer a good experience diagnosing stuff to do with her or his app. That resonates with me quite a bit as this is what we want to build our logging tool for.
I do have a fear that our logging solution will get saddled with business analytics and such (much like our on-premise version) that really doesn’t / shouldn’t belong there - we have other tools for that.
I’m going to list out some of the things I learnt about Loki though that make it appealing:
- It doesn’t index the text of the logs - instead grouping entries into streams and indexing those with metadata like labels. This approach makes it much easier to scale up for ingesting large log volumes, as it avoids the sharding problem on the underlying log data (and the index it does use is tiny). The trade-off comes in query times which, if they can’t be easily satisfied through your metadata, need to be brute forced
- It has a close relationship with Prometheus, embedding its service discovery libraries into the ingestion. This means things like the labels in Prometheus always match the labels in Loki and vice versa - no risk of human error. It also has some natural benefits in construction of query syntax
- It has what the speaker referred to as “airplane mode” - in other words you can deploy a bundled up version with a BoltDB backend and be up and running locally very easily to try stuff / develop against, whilst also being able to deploy a Cortex-like highly distributed solution in Prod (you saw that big diagram above, right? 😄)
- They’ve listened to developer feedback and quickly introduced things like real-time log tailing (coz who doesn’t love that!) and a
grep-like syntax (including with good ol’ pipes, plus a nifty-c-like flag for context - i.e. what are the log lines either side of what I’m looking at)
The downside though, Loki really doesn’t look like it’s ready yet 😢 … and we probably need to do something in this space soonish. Loki is still in alpha and they expect it to be in Beta in June. As the speaker puts it: “When can I use it in Production? Well Grafana use it - it occasionally lost some data, but now it’s really stable” …
… cue chuckles from the audience …