Tools To Visualise Your Kubernetes Cluster
My experience running a couple of open source tools to help visualise workloads deployed on Kubernetes

In this post I’m going to discuss a couple of tools I’ve used to help visualise workloads deployed on my Kubernetes clusters. The tools I’ll be looking at are:
- Kube Ops View
- WeaveWorks Scope
I’ll also finish by discussing some of the other approaches I am yet to try fully, but which might be better alternatives for larger clusters.
Background
I have been on-off interested in tools to help visualise all the things running on a Kubernetes cluster since I first got involved in Kubernetes. A bash script that hacks together a bit of kubectl to dump out the pods on each node (and also the built-in tools in the Google Cloud Console, since I use GKE) was an early creation that did a good enough job of satisfying my curiosity, but this is naturally hard to read and maintain.
My initial interest was motivated by trying to better understand how Kubernetes’ scheduler makes decisions on where to put workloads, and potentially to try to get better bin packing (I’ve written about this before). That interest later evolved into wanting to understand the interconnectedness (totally a word!) of workloads running on the cluster.
So Just How Loaded Are My Nodes, Anyway?

The first tool I’m going to mention is kube-ops-view. You can see my implementation of it here which is a simple implementation of some CI to deploy the upstream image into my cluster, along with its redis pod. We’ve found when running this on a large cluster at work (my definition of large being 150+ nodes and 3500+ pods) that it copes pretty well once it’s given enough resources (if the display keeps flashing, it needs more juice).
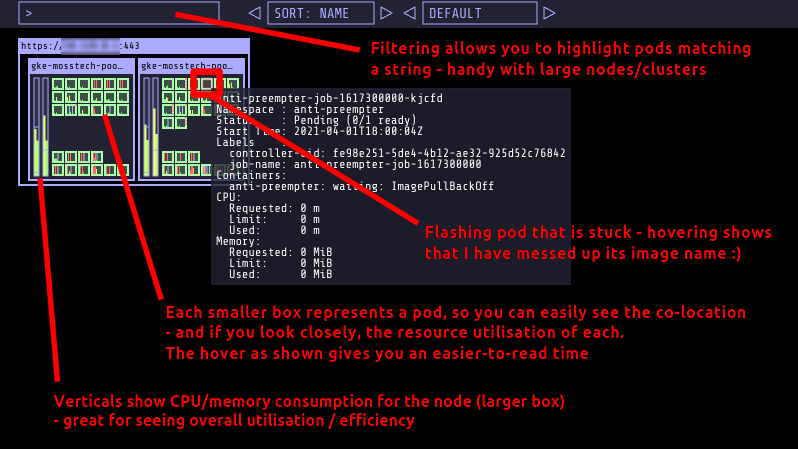
kube-ops-view running in my cluster
In the screenshot above we see the kube-ops-view UI running in my tiny cluster for running personal websites. I’ve highlighted a few of the interesting features.
The link to my github repo above contains the Kubernetes objects I use to deploy it from the upstream image. There’s some basic wiring, the recommended redis backend for caching the results, plus a simple basic-auth implementation that relies on my nginx ingress-controller. The app supports OAuth but I just haven’t got round to trying it out yet.
And just to prove it can, here’s a couple of screenshots of it running against one of our much larger clusters at work - 154 nodes and 3681 pods at time of writing.

kube-ops-view running in a larger cluster
It still feels pretty usable at this scale, especially combined with the filtering. You can see we’ve got our occupancy reasonably well sorted, particularly from a CPU perspective - as well as a few low occupancy nodes (they’re running the telemetry stack on dedicated nodes, as it happens). This doesn’t mean that the workloads are right-sized however - just that based on what they’re requesting, they’re packed reasonably.
For kube-ops-view to work reliably the resource requests/limits needed to be increased - in this case a 600Mi limit on memory with unbounded CPU, and requesting half a core + 300Mi of memory (and similar for the redis pods). This is 6x the size of the pods in the example manifests provided by its creator
I Need More. How Does It All Fit Together?

For this, I tried out WeaveWorks Scope. My original thoughts were to look to Netflix’s Vizceral as I had seen this before and it looked pretty cool, but this is sadly no longer maintained. A little bit of searching led me to Scope though, so I decided to give it a try, with mixed results.
You can see the adjustments I made to get it running in this github repo. The changes are primarily to attempt to reduce the permissions it needs to run as
On the plus side, Scope certainly did what I was after. I could use its UI to interrogate what was running on a node, and show the interconnectedness of workloads on the cluster. But it needs an awful lot of permission to work successfully - certainly in a work context rather than for a hobbyist cluster.
Here’s a couple of examples:
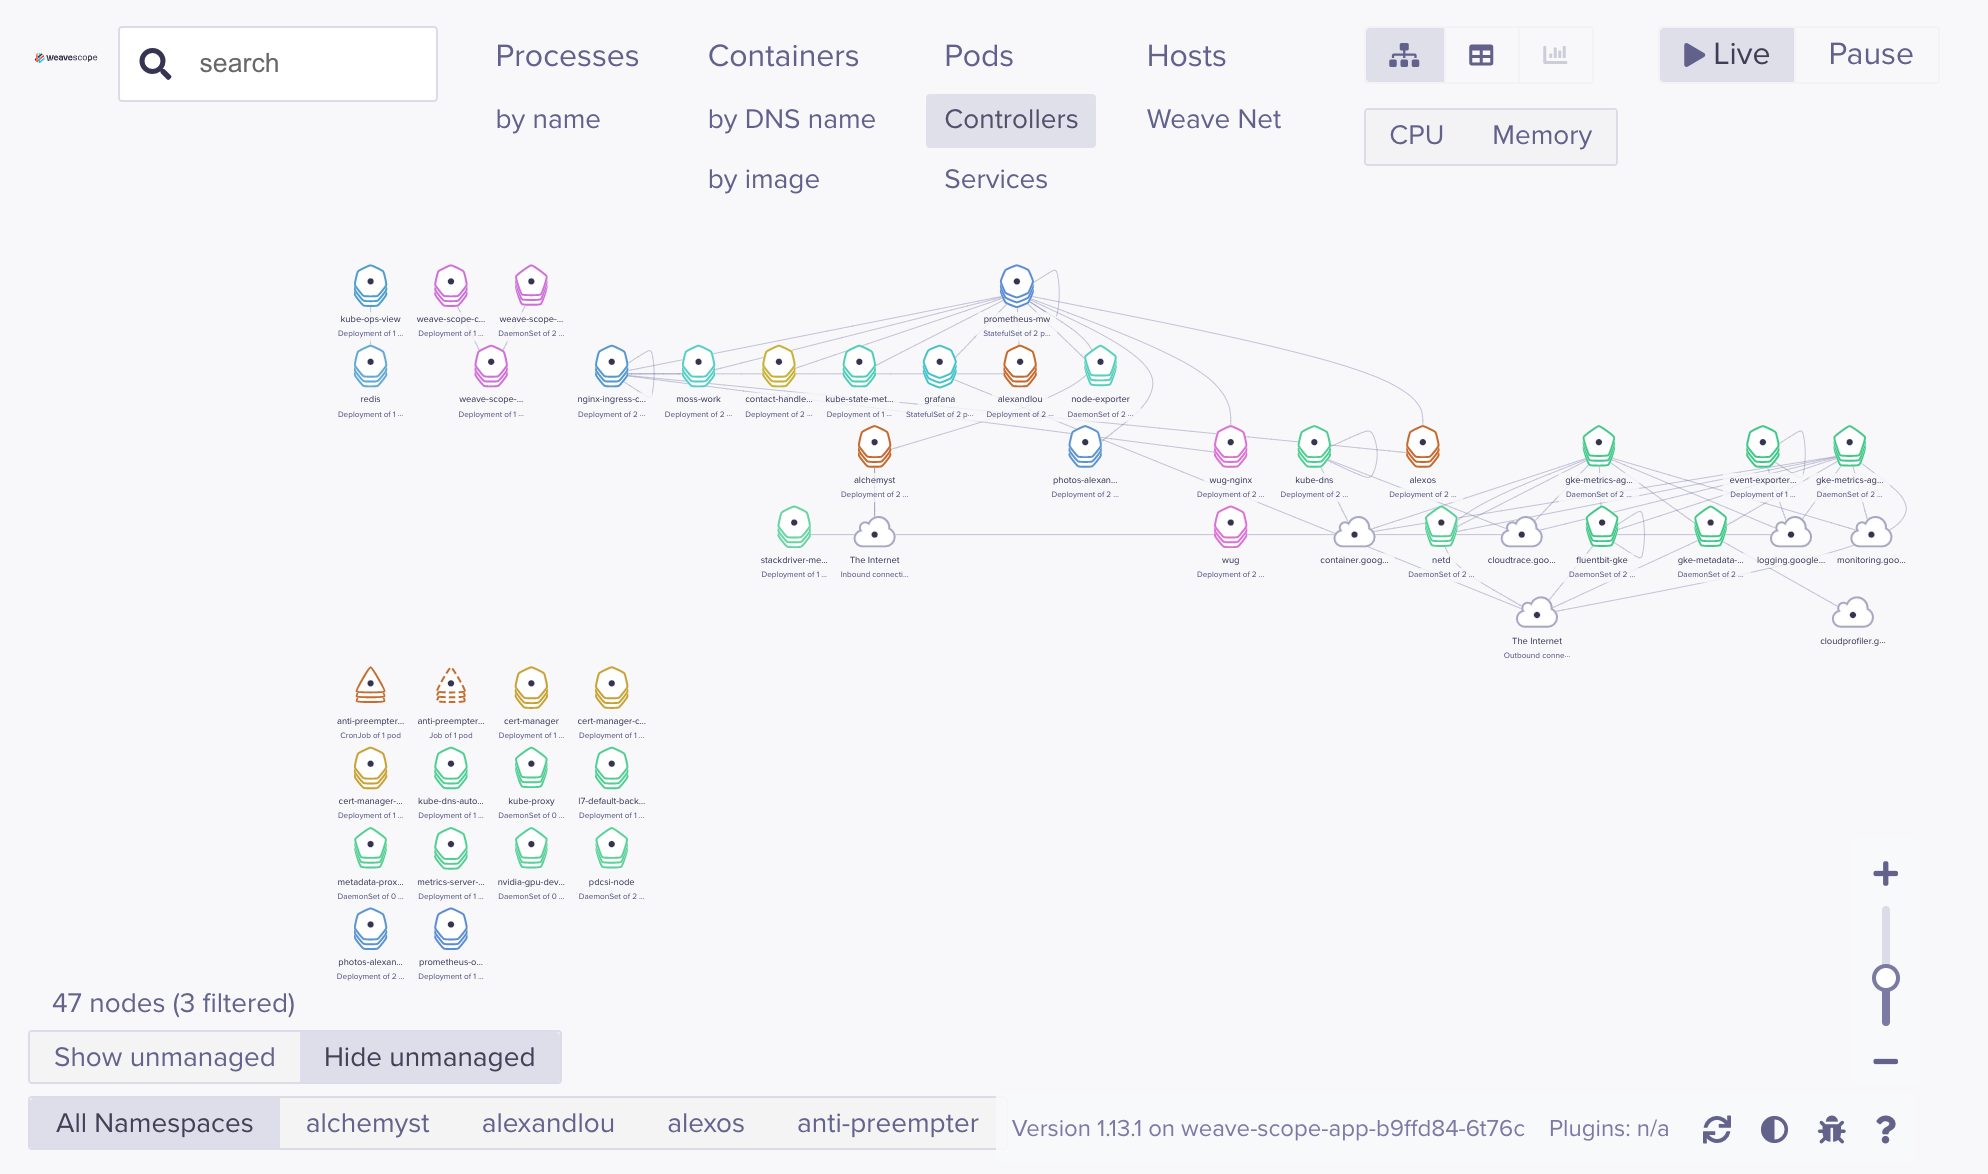
weave-scope - controllers view
The above shows the default landing page in Scope - a controller-centric view that immediately gives you an overview of what’s connected together. Note all the GKE bits n bobs it’s picking up, as well as outward connectivity to GCP services. Very cool - but also a clue as to scaling challenges to come - this is a tiny two node cluster with only 58 pods at the time this screenshots was taken.
That said, you can drill into more specific views - as these couple of screenshots show for a Deployment and a Node:
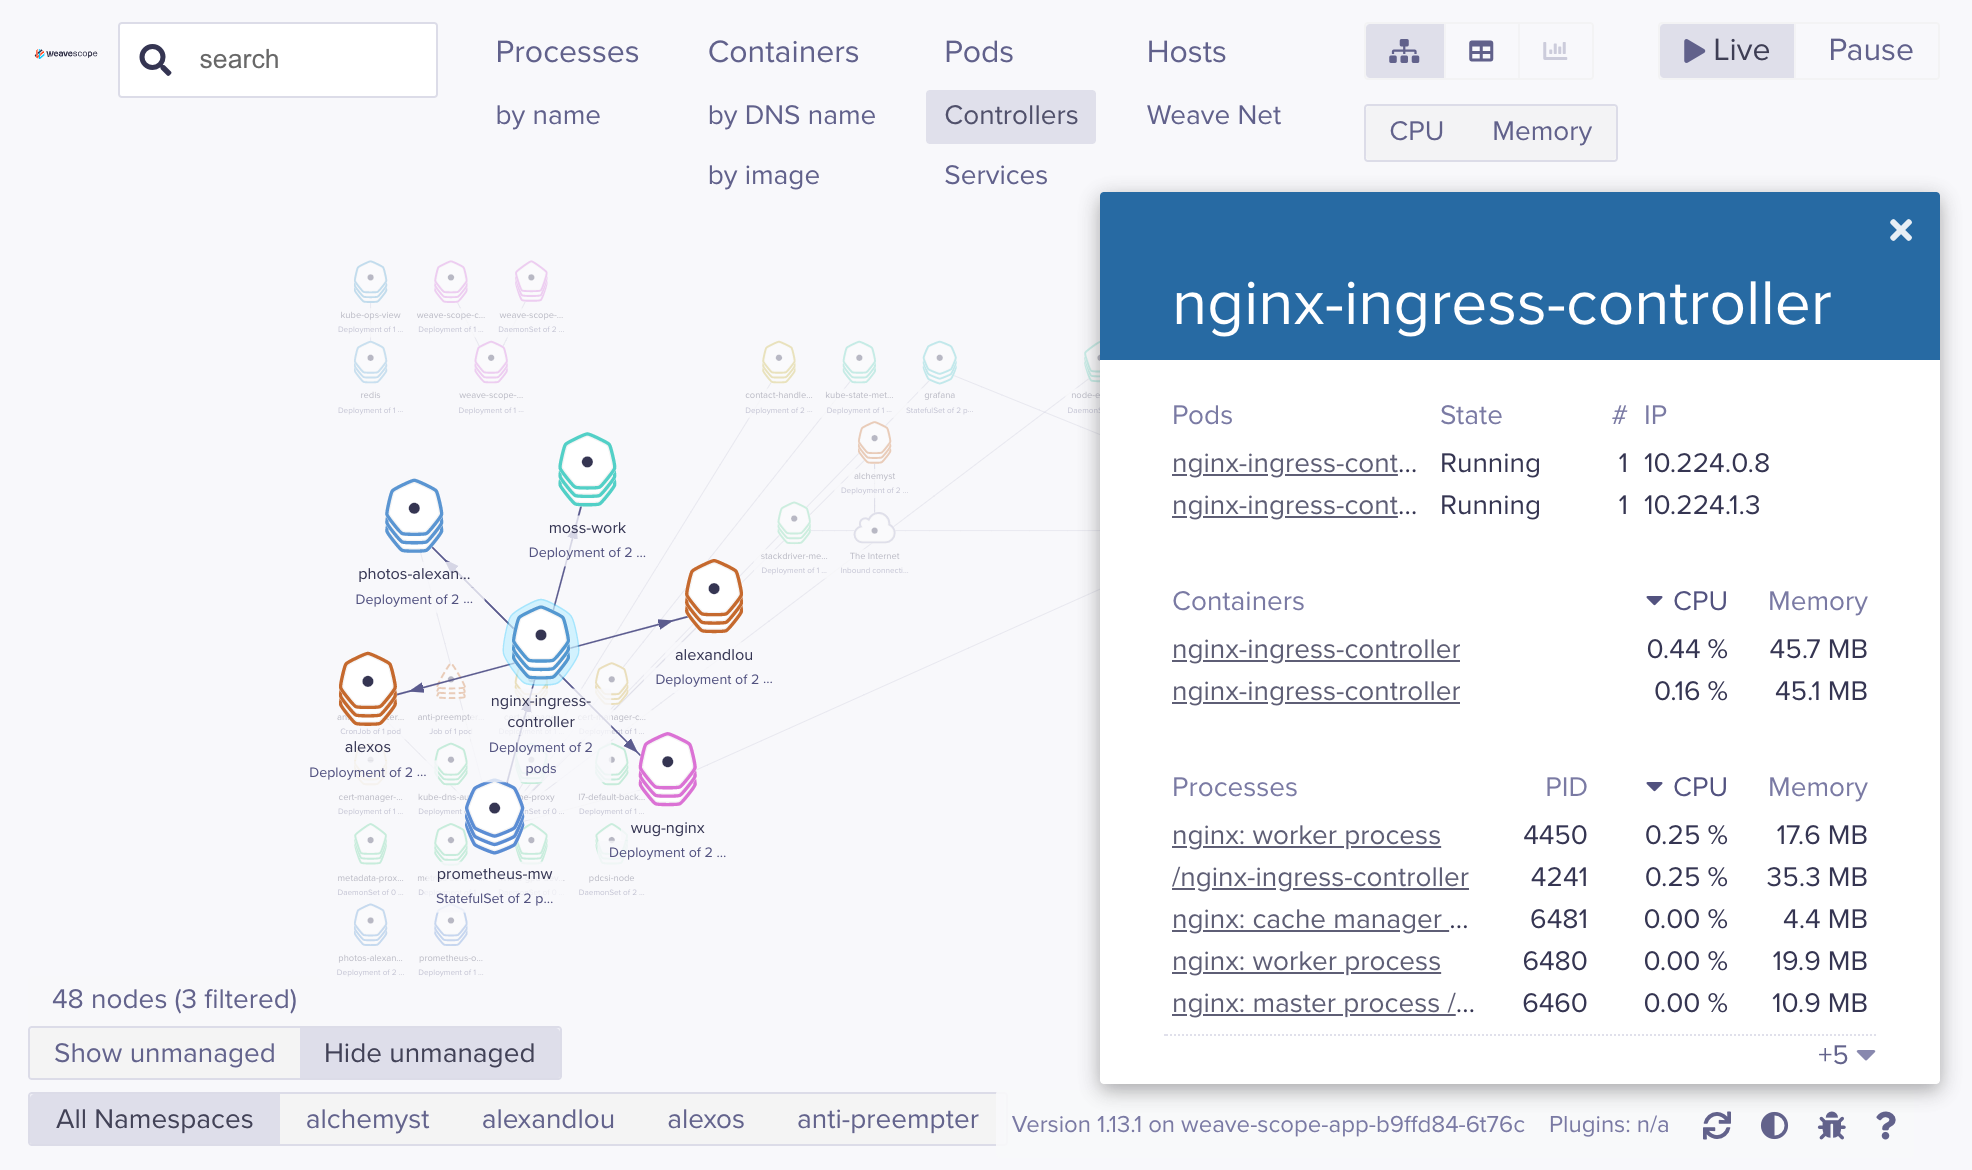
weave-scope - a deployment
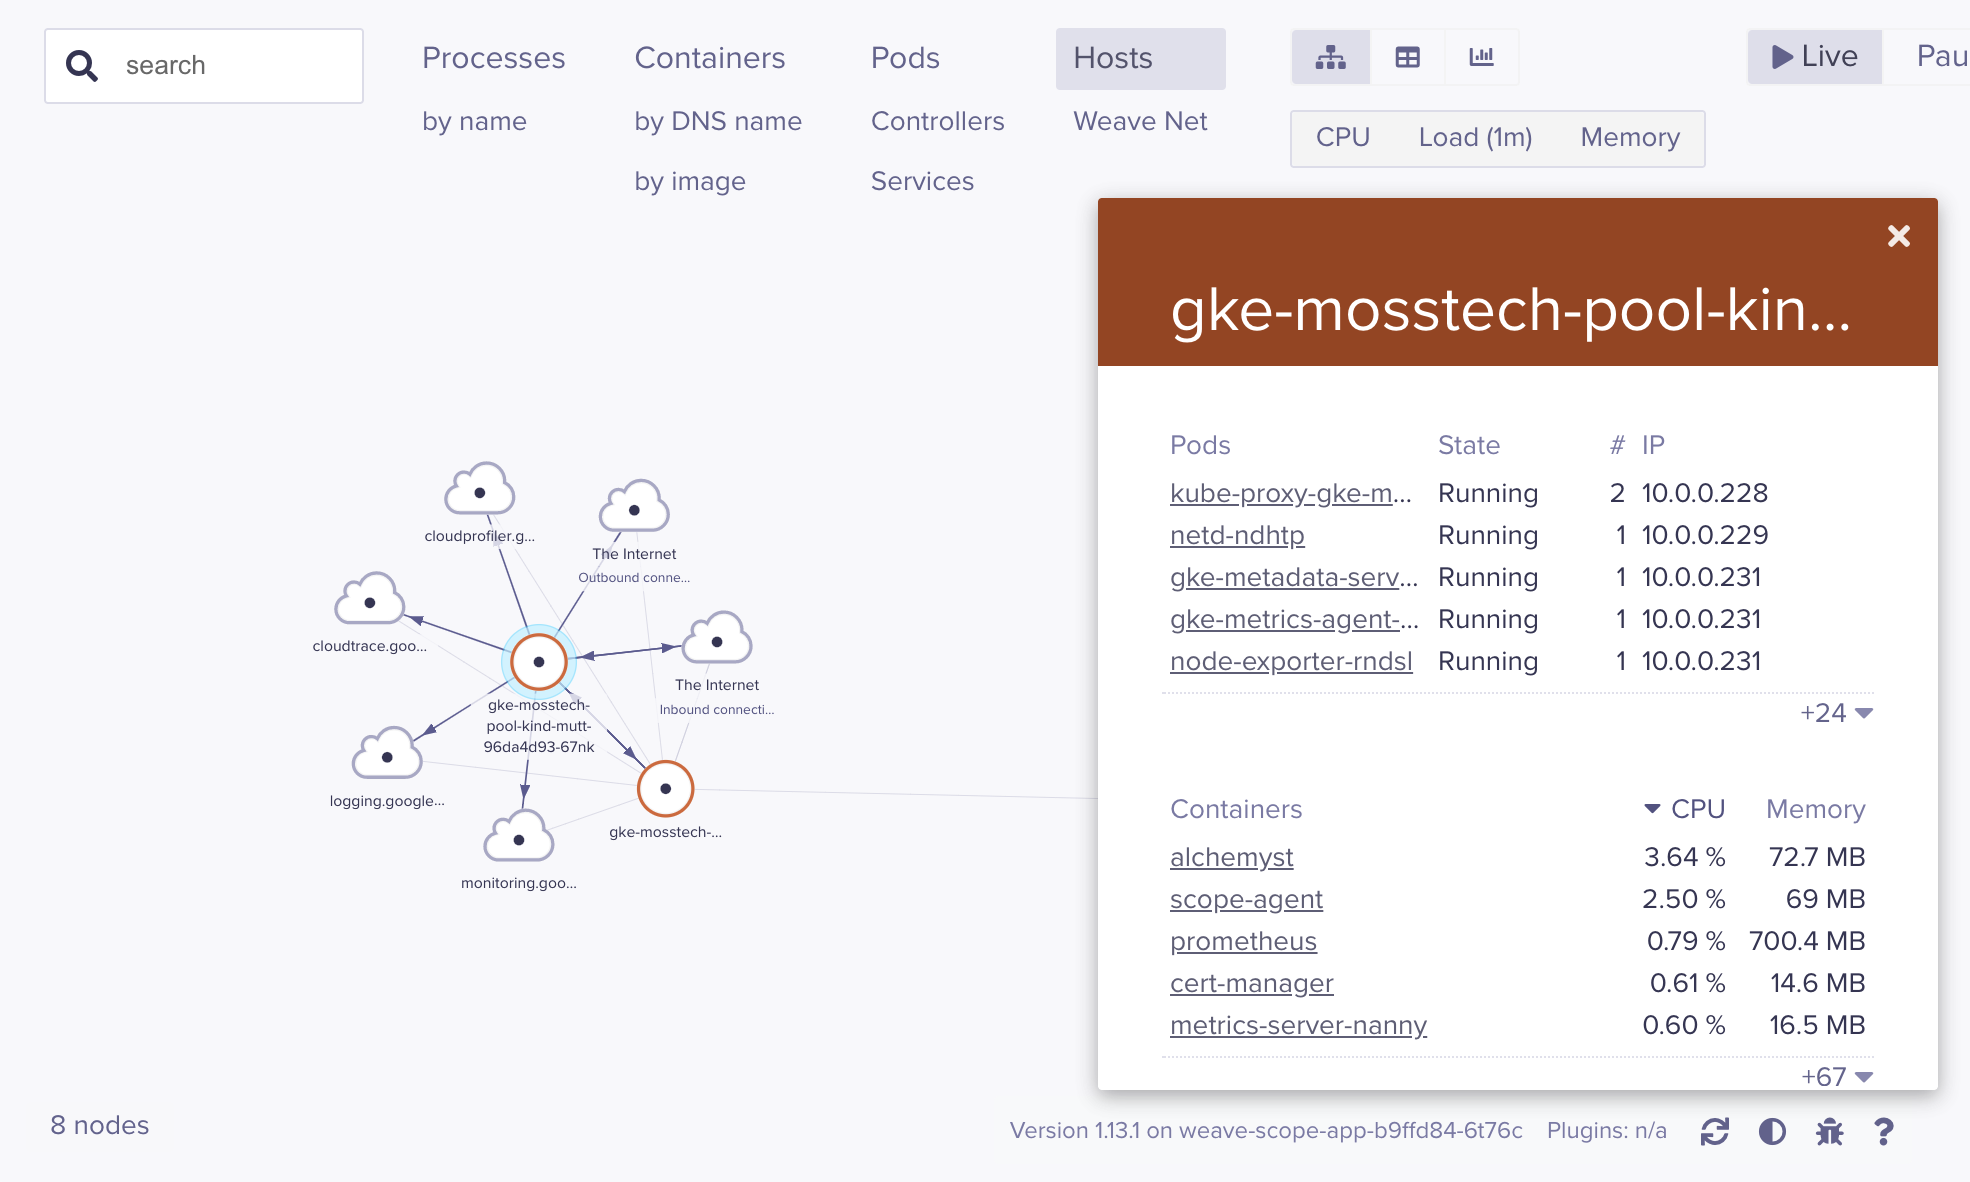
weave-scope - a node
There’s a rich amount of information here, as well as namespace filters along the bottom and a decent search facility. Nothing quite replicates the “pods on nodes at a glance” that I like about kube-ops-view above - but you do really get a sense of the connectivity / number of resource objects on your cluster with Scope.
My interest was peeked enough to spend a little time seeing whether I could reduce those permissions down a bit. The repo elaborates on this more detail - I had some success, but unsurprisingly, it needed a fair bit of privilege to be able to get at the data it needed:
- Disabled the ability to change workloads’ configuration in real time with
'--probe.no-controls=true'. Change should be made through code, always, in my strongly-held opinion! - Dropped privileges from its
ClusterRoleto only have get/list/watch - Tightened its
PodSecurityPolicy. This was successful for two of its three microservices- For
weave-scope-appandweave-scope-cluster-agentI could rebuild it from its upstream but modify its Dockerfile to run as non-root and my default restrictive PSP was fine - This was no good for the
weave-scope-agentDaemonSet, which is mounting host paths and sniffing the host network. I went through a few rounds of trial and error attempting to drop its system capabilities. It ultimately needs access tohostPID,hostNetworkandhostPathas root - at which point you may as well just let it run in privileged mode anyway! On the plus side, at least this the DaemonSet component rather than the user-facing bit
- For
Still, no way of avoiding it, it’s a potential vector for: a) gaining a huge amount of information on what’s running on the cluster and where, and b) extremely powerful if successfully broken into
So, do we run it in our 150 node clusters at work? Sadly no - on top of the security concerns above, when spinning up against clusters of the sizes described earlier in this post, it didn’t seem to work too well - services blipping in and out of the UI, very rarely able to render something as complex as that many microservices talking to each other.
To be fair, I did not try to resolve this - logs were silent, but most likely it just needed more juice (beyond the few extra pods I gave it). Vertically scaling a DaemonSet obviously comes with a not insignificant set of configurations - cost, risk of other workload evictions.
Was the tool useful enough to be worth that extra cost? Would we be happy enough to open it up through an ingress for our users, or leave it running in the background as an exploitable tool for an attacker? In the end, my conclusion was no, it was not.
For smaller clusters with less sensitive workloads though, Weave Scope is undeniably really cool though.
The Nirvana?

So where does that leave things? Weave Scope I think has a role to play especially with smaller clusters, but the security concerns - combined with sketchy reliability (which, to be fair, I did not investigate further so may be easily solved! 😉) - puts me off.
I think instead I’ll be aiming to solve my “what connects to what” question using a service mesh. I believe they’re mature enough and populous enough now to be worth the effort - and can be used to solve a whole bunch more problems (… hopefully more so than they create … 😁). As we look to roll this out at work, perhaps a few Meshy posts will start to pop up on this blog too as I get into the weeds of it!
If that doesn’t work out, there’s always Grafana plugins like this or this - which I haven’t tried out yet, but might be a good alternate option too
In the meantime, I’m happy with kube-ops-view to give me a quick overview of how my clusters are stacked up, with very low operating overheads - and I really recommend it as a handy tool to have available in your clusters.