Getting Down With The Kubernetes Krew
Some handy kubectl plugins found through the kubernetes plugin manager krew
In this post, after a brief intro to what krew actually is, I run through a dozen or so plugins I’ve installed using it which I find to be pretty handy time-savers. Hope you find at least one of them useful!

So, long time no post. I was resolved to posting more frequently in 2020 … and we’re at the end of February … so not so successfully then! Time to try to turn the tide …
On this occasion, I’ll be talking about krew. The focus of the post is some of the plugins that work for me, but there is a brief intro to what krew actually is if you’ve not heard about it before.
Notice how I managed to get this far without any mention of “top 10 krew plugins to help you devop harder”. That is a very deliberate avoidance of a clickbaity title. It’ll be interesting to see whether the article still gets picked up!
An intro to krew

In short, it’s a plugin manager for kubectl. Think brew or apt, but for your kubectl commands. Plugins have been a thing in Kubernetes since v1.12, and if you want to know a bit more about how they work then Ahmet Alp Balkan (creator of krew, as well as indispensable tools like kubectx & kubens) covers it really well here.
Installation instructions are straight-forward as you’d expect, and the basic usage is intuitive (I alias krew='kubectl krew'):
krew list- list your plugins installed through krew. If you only use krew to do this, this should be the same askubectl plugin listkrew search <string>- find plugins. Without<string>, all are listedkrew info <plugin>- more info about what a plugin does. I always check this to make sure a plugin isn’t going to do something dubious - it invariably contains a link to the source code. And let’s be honest, you’re basically running someone else’s bash on your PC with these pluginskrew install <plugin>- installs it - it can then be used throughkubectl <plugin>krew upgrade- upgrade your plugins
At time of writing, there are now ~70 plugins available through it. I feel like when I first started looking at krew in mid-2019, there were only a couple of dozen, so usage is clearly accelerating! 👍
On with the plugins themselves …
Viewing resources

First up in this section we have kubectl tail (usually kail). This is a handy plugin for tailing logs - it’s just nice and simple. There are a number of alternatives out there (I know some folks like Stern, which I’ve never got round to trying). The main feature I like is being able to target a deployment/service/ingress (e.g. kubectl tail --ing=mosstech) and be able to watch all the logs from the pods behind it, without necessarily needing to know how the resource has been labelled.
kubectl get-all does exactly what it says on the tin. They are not kidding - this really gets everything, as the plugin info page says. I’ve found this to be increasingly useful with our uptake of CustomResourceDefinition - i.e. where you may not be able to remember every type of object that exists in a namespace any more (usually because I want to delete stuff …). This plugin helps a lot with that:
[~ (⎈ |sandpit-prod:prometheus)]$ kubectl get-all -n=prometheus
NAME                                                                      NAMESPACE   AGE
configmap/prometheus-sandpit-rulefiles-0                                  prometheus  14d
endpoints/prometheus-operated                                             prometheus  20d
persistentvolumeclaim/prometheus-storage-prometheus-sandpit-0             prometheus  20d
# [...]
prometheus.monitoring.coreos.com/sandpit                                  prometheus  20d
prometheusrule.monitoring.coreos.com/prometheus-k8s-rules                 prometheus  14d
servicemonitor.monitoring.coreos.com/prometheus-operator                  prometheus  16d
poddisruptionbudget.policy/prometheus                                     prometheus  20d

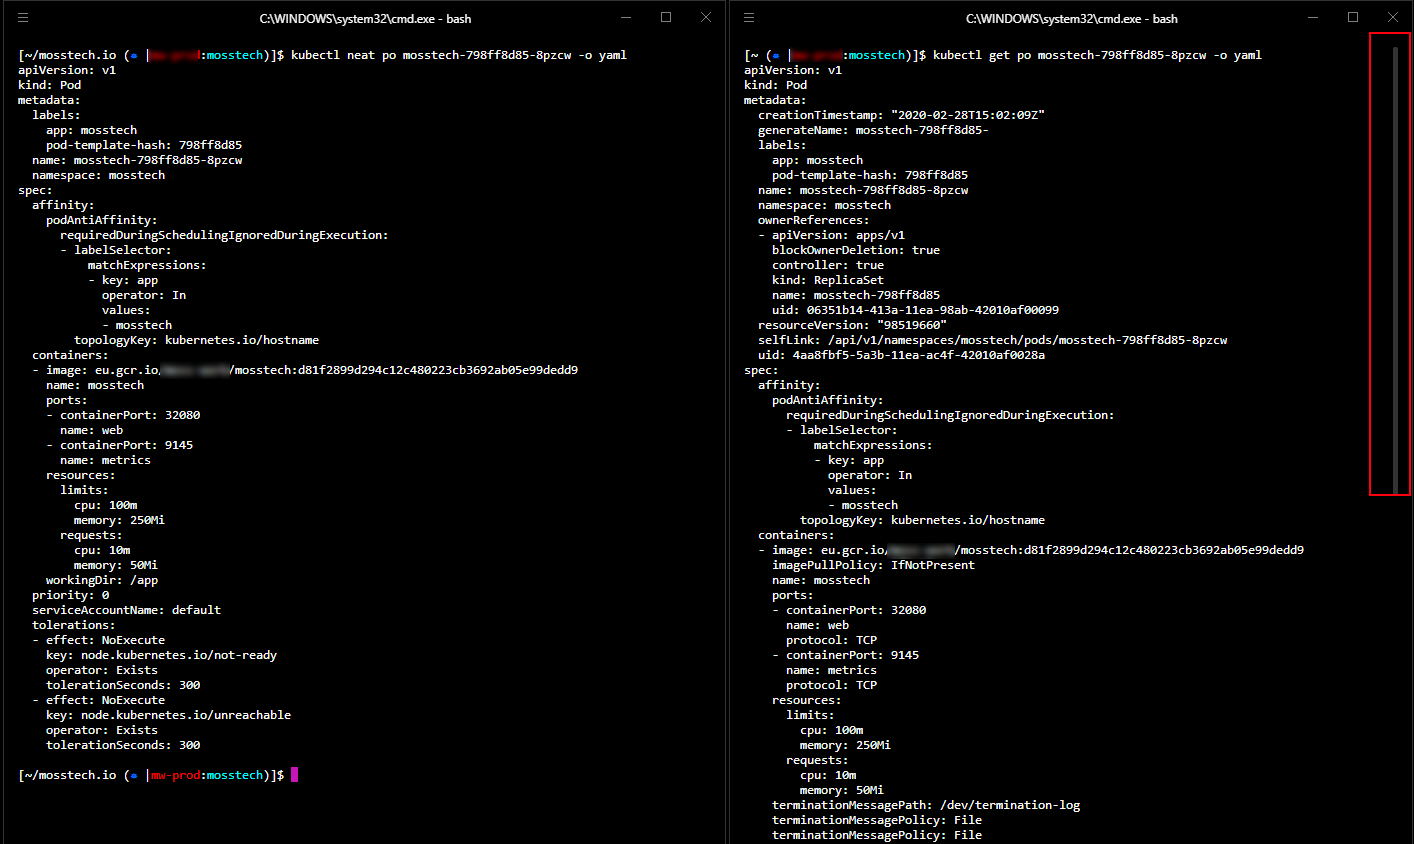
Almost the opposite is kubectl neat which, as the name sort-of-implies, neatens up verbose output. If you find your mind glazing over the system-injected annotations and such when get you get a pod’s details, this one might be for you - it strips the gumpf from kubectl get - for example:
Lastly for this section, are a couple of plugins that help visualise the relationship between a resource and other things in the cluster. kubectl pod-dive is good if you want to know what surrounds a particular pod, e.g.
[~ (⎈ |sandpit-prod:prometheus)]$ k pod-dive prometheus-sandpit-0
[node]      gke-sandpit-prod-np-0-947e5a45-84zk [ready]
[namespace]  ├─┬ prometheus
[type]       │ └─┬ statefulset
[workload]   │   └─┬ prometheus-sandpit [2 replicas]
[pod]        │     └─┬ prometheus-sandpit-0 [running]
[containers] │       ├── prometheus [228 restarts]
             │       ├── prometheus-config-reloader [0 restarts]
             │       └── rules-configmap-reloader [0 restarts]
            ...
[siblings]   ├── grafana-0
             ├── nginx-ingress-controller-85744dcf89-nswr9
             ├── fluentd-gcp-v3.1.1-bzh54
             ├── heapster-v1.6.1-5b6bf6cc74-cnnlh
             ├── kube-proxy-gke-sandpit-prod-np-0-947e5a45-84zk
             ├── prometheus-to-sd-cjkwx
             ├── node-exporter-7ml5r

WAITING:
    prometheus crashloopbackoff (Back-off 5m0s restarting failed container=prometheus pod=prometheus-sandpit-0_prometheus)
TERMINATION:
    prometheus error (code 1)

Somewhat similarly, kubectl tree shows the hierarchy for a particular resource - especially useful when working with CustomResourceDefinition. For example, here’s a view from my failing Prometheus pods (installed using the prometheus CoreOS operator):
[~ (⎈ |sandpit-prod:prometheus)]$ kubectl tree prometheus sandpit
NAMESPACE   NAME                                                  READY  REASON              AGE
prometheus  Prometheus/sandpit                                    -                          20d
prometheus  ├─ConfigMap/prometheus-sandpit-rulefiles-0            -                          14d
prometheus  ├─Secret/prometheus-sandpit                           -                          20d
prometheus  ├─Service/prometheus-operated                         -                          20d
prometheus  └─StatefulSet/prometheus-sandpit                      -                          20d
prometheus    ├─ControllerRevision/prometheus-sandpit-6f6fcd787b  -                          20d
prometheus    ├─Pod/prometheus-sandpit-0                          False  ContainersNotReady  29h
prometheus    └─Pod/prometheus-sandpit-1                          False  ContainersNotReady  3h
Resource usage

There are a whole bunch of plugins in this area - I’ve picked out a couple that I think do a bit more than is easily achieved with some kubectl-foo. Some of these were particularly helpful when trying to squeeze more out of my tiny ‘home’ GKE cluster.
First, kubectl resource-capacity offers a nice and simple view for an overall cluster usage:
NODE                                  CPU REQUESTS   CPU LIMITS     MEMORY REQUESTS   MEMORY LIMITS
*                                     1136m (60%)    5795m (308%)   3147Mi (59%)      10983Mi (208%)
gke-sandpit-prod-np-0-3be8d635-6s5n   694m (73%)     3406m (362%)   1812Mi (68%)      5774Mi (218%)
gke-sandpit-prod-np-0-947e5a45-84zk   442m (47%)     2389m (254%)   1335Mi (50%)      5209Mi (197%)
Occasionally, info about disk utilisation is useful, and not super-obvious from other sources (like kubectl get) … enter kubectl df-pv:
PVC                            NAMESPACE    POD                    SIZE          USED        AVAILABLE     PERCENTUSED   IUSED   IFREE     PERCENTIUSED
prometheus-storage-sandpit-1   prometheus   prometheus-sandpit-1   21003583488   541843456   20444962816   2.58          3729    1306991   0.28
grafana-data-grafana-1         grafana      grafana-1              1023303680    3493888     1003032576    0.34          23      65513     0.04
prometheus-storage-sandpit-0   prometheus   prometheus-sandpit-0   21003583488   533467136   20453339136   2.54          3744    1306976   0.29
grafana-data-grafana-0         grafana      grafana-0              1023303680    80232448    926294016     7.84          24      65512     0.04
And finally, kubectl view-allocations is handy for spotting pods without resource requests/limits (it’s not obvious from the capture below, but it highlights these in red):
Housekeeping

If you’re running a cluster that’s been around for a while, there are a few plugins that help you track down old or unused object:
kubectl deprecations- as the name suggests, warns you of objects in your cluster using older versions of objects. On my home setup, it was pretty good at telling me about all the APIs I was using that I’d specified usingv1beta1for example 😄kubectl prune-unused configmaps --dry-runis a handy one - it wipes out (… in other words you should definitely run with--dry-runfirst …) unusedSecrets orConfigMaps. Great for clusters I use for experimentation - which often leads to trashing things that don’t work outkubectl outdatedis a very neat idea - it finds images that running older versions than what’s out there in public - you can see it in action below:
Note that as it needs to be able to connect to the registry anonymously, it can’t check things that are in my private GCR - but then again, they should have healthy CI/CD pipelines pushing out the latest image automatically. If you pull and re-tag images privately though (e.g. to run them through a vulnerability scanner) then this is a bit less useful to you (or at least, it is without some fiddling).
Security
I’ll be the first to admit I didn’t “get” the RBAC setup in Kubernetes straight away. Even though I feel like I now do, having a couple of plugins to visualise permissions I find really useful, especially at work where our setup is needfully more complex.
The first of these is kubectl access-matrix, which in an RBAC-enabled cluster (which you really, really should have by now) has two modes:
kubectl access-matrix [-n=namespace]displays a table showing what the current user can do against each resource type. With no namespace, it looks at the cluster scopekubectl access-matrix for <resource>displays, for a given resource (e.g.pod), which users/groups/serviceaccounts can perform which roles in which namespaces if applicable.
It is the latter I find particularly helpful in our PodSecurityPolicy-enabled, multi-tenant (i.e. permissions per namespace) cluster at work.
Related is kubectl who-can, which as the name suggests shows which subjects can perform what actions on which objects. For example, the following tests who can create a Service in the sandpit namespace:
[~ (⎈ |sandpit-prod:default)]$ kubectl who-can create services -n=sandpit

No subjects found with permissions to create services assigned through RoleBindings

CLUSTERROLEBINDING                 SUBJECT                           TYPE             SA-NAMESPACE
cert-manager                       cert-manager                      ServiceAccount   kube-system
cluster-admin                      system:masters                    Group
elastic-cluster-admin-binding      some-sa@some-project.iam.[...]    User
prometheus-operator                prometheus-operator               ServiceAccount   prometheus
In a better policed cluster than my sandpit 😁 you’d expect to see something a bit tighter than this!

If you’re worried about the hardening of your pods and willing to trust the folks at kubesec.io, then kubectl kubesec-scan is quite interesting. Here’s some output from an old deployment I know still has some dodgy stuff in it 😜
[~ $ kubectl kubesec-scan deployment dodgy-app -n=dodgy
scanning deployment dodgy-app in namespace dodgy
kubesec.io score: -56
-----------------
Critical
1. containers[] .securityContext .capabilities .add | index("SYS_ADMIN")
CAP_SYS_ADMIN is the most privileged capability and should always be avoided
2. containers[] .securityContext .privileged == true
Privileged containers can allow almost completely unrestricted host access
-----------------
Advise1. containers[] .securityContext .runAsNonRoot == true
Force the running image to run as a non-root user to ensure least privilege
2. containers[] .securityContext .capabilities .drop
Reducing kernel capabilities available to a container limits its attack surface
3. containers[] .securityContext .readOnlyRootFilesystem == true
An immutable root filesystem can prevent malicious binaries being added to PATH and increase attack cost
4. containers[] .securityContext .runAsUser > 10000
Run as a high-UID user to avoid conflicts with the host's user table
5. containers[] .securityContext .capabilities .drop | index("ALL")
Drop all capabilities and add only those required to reduce syscall attack surface
And finally in this section, a quick one for the lazy / keyboard efficient - kubectl view-secret [<secret>] [<key>] [-all] - no need to base64 decode things - tedious!
Debugging

In the last section, I cover a few plugins that can help with debugging issues.
First up, another one for those who don’t like typing - kubectl iexec - simplifies the kubectl exec -it <pod> /bin/sh wrapper by offering an interactive menu to pick the pod (+ container) you want to exec onto. kubectl pod-shell does basically the same thing too.
Sometimes - hopefully rarely - you need to elevate privilege to get to the bottom of what’s going on. There are a few krew plugins that help with this process, assuming you have enough permissions to do so.
kubectl node-admin is scary - it spins up a privileged Pod with the host node mounted, effectively acting as a “remote onto nodes” container. It basically does this …
kubectl run node-admin -i -t --rm --restart=Never --image=debian:latest --overrides="${SPEC_JSON}"
… where SPEC_JSON built up with a whole load of scary privileges to do stuff). Powerful, if for some ungodly reason you need to get onto a node directly. kubectl node-shell does largely the same thing too (except with alpine, and no fancy node-picker).
kubectl spy (kubespy) is a handy little utility for spinning up a (privileged) pod that can attach to another pod for debugging purposes. There is also kubectl debug, but this needs the 1.16 alpha feature EphemeralContainers switched on, which I don’t have. kubectl spy looks a bit like this:
[~ (⎈ |sandpit-prod:mosstech)]$ kubectl spy mosstech-798ff8d85-4qfp5
loading spy pod...
If you don't see a command prompt, try pressing enter.
/ # ls -la
total 44
drwxr-xr-x    1 root     root          4096 Feb 16 21:13 .
drwxr-xr-x    1 root     root          4096 Feb 16 21:13 ..
-rwxr-xr-x    1 root     root             0 Feb 16 21:13 .dockerenv
drwxr-xr-x    2 root     root         12288 Dec 23 19:21 bin
drwxr-xr-x    5 root     root           360 Feb 16 21:13 dev
drwxr-xr-x    1 root     root          4096 Feb 16 21:13 etc
drwxr-xr-x    2 nobody   nogroup       4096 Dec 23 19:21 home
dr-xr-xr-x  230 root     root             0 Feb 16 00:09 proc
drwx------    1 root     root          4096 Feb 16 21:13 root
dr-xr-xr-x   12 root     root             0 Feb 16 00:08 sys
drwxrwxrwt    2 root     root          4096 Dec 23 19:21 tmp
drwxr-xr-x    3 root     root          4096 Dec 23 19:21 usr
drwxr-xr-x    4 root     root          4096 Dec 23 19:21 var
/ # ps -ef
PID   USER     TIME  COMMAND
    1 101       0:00 nginx: master process nginx -g daemon off;
    6 101       0:00 nginx: worker process
   13 root      0:00 sh
   19 root      0:00 ps -ef
Meanwhile, a new busybox pod is running:
[~ (⎈ |sandpit-prod:mosstech)]$ kubectl neat pods spy-5092 -o yaml
NAME                       READY   STATUS    RESTARTS   AGE
mosstech-798ff8d85-8pzcw   1/1     Running   0          45h
mosstech-798ff8d85-9vd47   1/1     Running   0          6d10h
spy-5092                   1/1     Running   0          5m21s
And finally …
And, if you’ve made it this far, I’ve saved the best till last. Are you brave enough to try … kubectl snap!

For Avengers fans hopefully what this is going to do is obvious 😁 (It deletes half of … everything)
In reality, it is somewhat gentle - see recording below: